
UPDATE on 07 July 2021: Note that the latest version of balenaSense (v2) does not allow data from multiple sensors to be aggregated using the steps outlined in this post. To aggregate data in v2, see our updated guide.
Back in March we wrote about balenaSense, our project to monitor air quality with a Raspberry Pi, Grafana and InfluxDB. Lots of you have been using this project and giving great feedback, and one of the requested features was the ability to take data from multiple balenaSense devices and bring it together for monitoring centrally. We’ve updated the project to v1.5 to include this functionality, so we’re going to take a look at that today and use it as an opportunity to test the new InfluxDB Cloud 2.0 Beta!

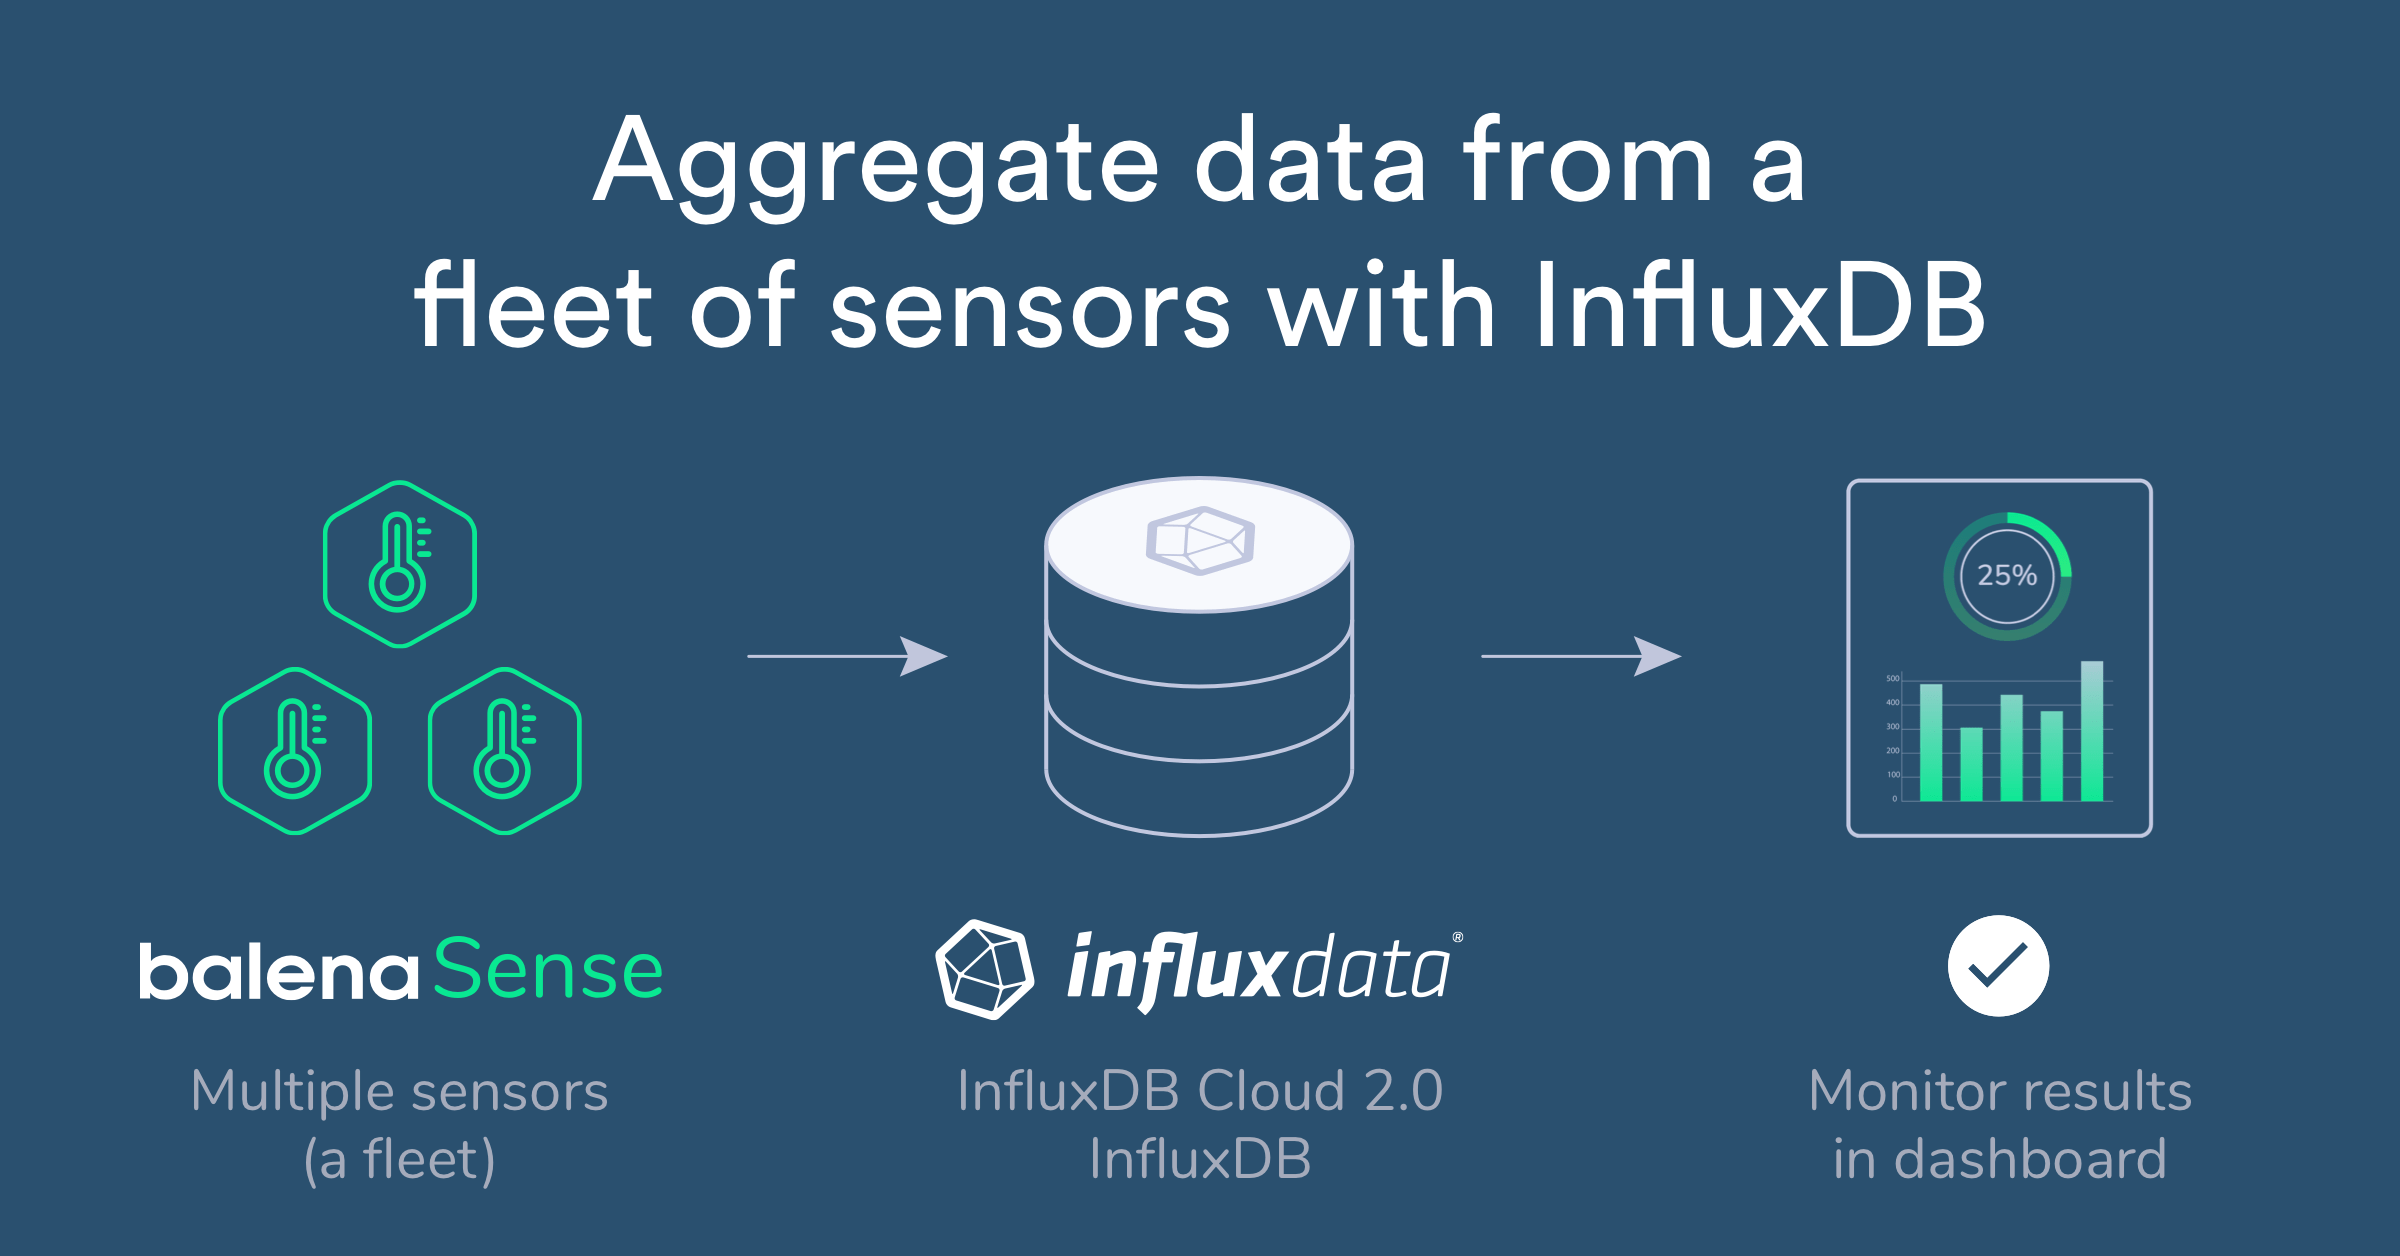
Why aggregate your data?
balenaSense is perfect if you’re just running a single device; it’s self-contained and all the requirements are taken care of. There’s no dependency upon external services, the data is logged to the internal storage (usually the SD card), and a Grafana web interface is provided to access the reports and monitor trends.

What if you want to add a second sensor? If you’re monitoring one part of your house such as a home office, wouldn’t it be interesting to compare it to a bedroom where you also spend a significant percentage of your day? To do this you can simply add an extra device to your existing application and balenaCloud will take care of the rest by deploying the software and provisioning the device automatically. However, this leaves you with two (or more!) devices to check individually from a web browser, and no means to compare the data.
This is where data aggregation comes into play! We are going to show you how you can configure both balenaSense devices to log their data to a central location, allowing you to access reports and compare data from one place. To do this you will need to deploy the latest version of balenaSense (v1.5.x) and set up a few configuration variables. Let’s get to it!
Deploy the latest version of balenaSense on balenaCloud
To follow along with this guide you need to be running balenaSense v1.5 or higher. If you’re already running the application on balenaCloud, to update is as simple as downloading the latest version from GitHub and pushing the code to your balenaCloud application in the same way as you did before; this can be via balena push or git push but you can read more about deployment methods in our docs. You don’t need to flash your SD card again or even be anywhere near the device, the beauty of balenaCloud means everything can be done over the air.
If you’re not yet running balenaSense, check out our full deployment guide to get your device up and running before coming back to resume the setup here.
What’s changed in balenaSense v1.5?
Since its creation, balenaSense has been using the excellent InfluxDB client library for Python, which, incidentally, is partly maintained by a colleague of mine here at balena. This has been working perfectly, but I wanted to add some flexibility by allowing users to configure their own data output and facilitating the feed of data to multiple endpoints. In light of this, it made sense to implement Telegraf which plays very nicely with InfluxDB, and takes care of the recurring measurements.
To implement Telegraf, the sensor aspect of balenaSense was changed. As of v1.5, it is no longer a loop running on a schedule to feed data into the local InfluxDB instance every 10 seconds, but rather a basic HTTP server providing an interface for an external application to retrieve the readings from the sensors in JSON format. This means the container does not depend on the InfluxDB Python library anymore as it is no longer writing directly to the database.
A new container was added, for Telegraf. This has been setup to replace the functionality in earlier versions of balenaSense by writing the sensor data to the local InfluxDB instance, allowing the Grafana web interface to continue working in the same way it has done to date. However, now that we’re using Telegraf it’s easy for you to add your own output plugins to feed the recorded sensor data to any other location. You could run your own InfluxDB instance centrally and aggregate all of your data, or you could use a service such as InfluxDB Cloud, we’re going to look at both here. As the system now has a standard Telegraf config file you’re free to add any output plugins you’d like and feed the data to any other endpoint.
Set up data aggregation with InfluxDB Cloud
Introducing InfluxDB Cloud 2.0 (beta)
Note: at the time of writing this product is still in beta so the following information may be subject to change
The cloud version of InfluxDB is offered as a Time Series Platform as a Service. What this means for us is that we can use it as a cloud instance of InfluxDB, to which we can feed data from a fleet of balenaSense devices. From this central location, you can then look at analytics and reporting across your entire fleet.
InfluxData (the makers of InfluxDB) have decided to offer a free tier within InfluxDB Cloud 2.0, which didn’t exist in the first version of the product. Although it offers only 3 days of data retention, the free tier is great news for us as it means we can experiment and use the product ongoing for zero cost. It’s currently stated on the InfluxDB Cloud 2.0 site that they intend to retain this rate-limited free tier going forward.
We’ve preconfigured the new Telegraf instance within balenaSense to use InfluxDB Cloud 2.0 if enabled by setting a few configuration variables within the balenaCloud dashboard that tell the application where to send the output data.
Set up your account
First, create an account on the InfluxDB Cloud 2.0 site and sign in.
Next, go to settings and create a bucket. I’ve called my bucket balenaSense; we’ll need to remember this for later.

After that, go to tokens and generate a new Read/Write token. This is used to authorize your balenaSense device with your InfluxDB cloud account. You can use the same token for all your devices, you just need to ensure that the token has read/write access to the bucket you created a moment ago. The description is not important here and only for your reference, I called mine balenaSense RW.

That’s all we need from InfluxDB cloud for the moment!
Set configuration variables within balenaCloud
If you’ve updated and are running a version of balenaSense greater than v1.5, setting the following environment variables within balenaCloud will enable the data feed to InfluxDB cloud.
You’ll need the bucket name, token and your login email address from the previous step. These variables can be applied at the application level so they will apply to all of your devices.
INFLUX_BUCKET– the name of the bucket you createdINFLUX_ORG– your login email address used for InfluxDB cloudINFLUX_TOKEN– the read/write token for your bucket
Note: the feed won’t be enabled unless all variables are set.
Next, you can specify a per-device variable, to tag that data with a location or other identifier. Note that this isn’t required, as by default the device hostname will be used as an identifier, but if you’d like a friendly ID that can be set here.
BALENASENSE_ID – your friendly ID, e.g. living-room, shed, warehouse etc.
Your dashboard should now look something like this:

If everything has been set up correctly, you should see the following in the logs for your device on the dashboard when the Telegraf container starts:

Create a dashboard
Once everything is working, you can return to your InfluxDB cloud account and use the data explorer to see your data!

You can see that you’re now able to plot all of the same metrics as you could on an individual balenaSense device, but with the added benefit that you can plot data from multiple devices on the same chart! balena_sense_id in the fourth column from left is being populated with the value that you specified in the BALENASENSE_ID environment variable in the dashboard.
Now that you’ve confirmed that the data is flowing in from your devices, you’re free to create a dashboard. Click on dashboards on the left-hand menu and create a new dashboard, I’ve again (creatively!) named mine balenaSense.

That’s it for setting up a feed to InfluxDB Cloud. The platform is still in the early stages so it’s not perfect, but it’s under active development so it’s exciting to see where it will go in the future.
Set up data aggregation with InfluxDB
If you don’t want to use InfluxDB cloud, thanks to the Telegraf implementation, it’s also easy to feed data to a local InfluxDB instance if you have one. You’ll need to know the HTTP URL of your InfluxDB instance, along with a username and password. Once these three variables are defined as below, Telegraf will start feeding to this database too.
Install InfluxDB
The first thing you’ll need to do is set up an InfluxDB instance elsewhere, this can be on your local network, or online, as long as the networking has been configured so that your balenaSense devices can access it. Setting up your InfluxDB instance is outside the scope of this article but there are plenty of guides for this; for the most part it’s as simple as installing it from the package manager on your OS.
Configure Telegraf
Next, in the same way as we looked at for InfluxDB Cloud, we can set a few configuration variables within the balenaCloud dashboard, which will enable the data output stream within Telegraf. The variables are:
INFLUXDB_EXTERNAL_URL– the HTTP URL to your InfluxDB instanceINFLUXDB_EXTERNAL_USERNAME– the username for authentication to your InfluxDB instanceINFLUXDB_EXTERNAL_PASSWORD– the password for authentication to your InfluxDB instance
Note: the feed won’t be enabled unless all variables are set.
Next, just like you can with InfluxDB cloud, you can specify a per-device variable, to tag that data with a location or other identifier. Note that this isn’t required, and by default the device hostname will be used as an identifier, but if you’d like a friendly ID that can be set here.
BALENASENSE_ID – your friendly ID, e.g. living-room, shed, warehouse etc.
Your dashboard should now look something like this:

You should find that with these variables set you see the following message in the logs, confirming that the feed to an external database is working:

Set up a dashboard
Unlike InfluxDB cloud, which comes with Chronograf built in, the standalone version of InfluxDB does not include any software for data visualisation. If you’ve used balenaSense in the standalone form, you’ll remember that it uses Grafana, and you can do the same thing here. You’ll need to install Grafana or Chronograf standalone, typically this is done on the same host as your InfluxDB server, but it doesn’t have to be. Both Grafana and Chronograf play nicely with InfluxDB and will allow you to present the information in the same way as the standalone version of balenaSense, with the added benefit that you can now plot and compare data from multiple sensors at once – brilliant!
Disable local logging
If you find that the new external database connections work well for you, you might wonder why the internal InfluxDB is necessary! You can disable the feed from Telegraf to the InfluxDB instance running on your device by setting DISABLE_INTERNAL_INFLUXDB to TRUE. Note that this will only disable the data feed and will not disable InfluxDB itself, so you can still access any historical data.
Until next time…
We looked at two ways to feed the data from a fleet of balenaSense devices into a central database; InfluxDB Cloud 2.0 and a standalone InfluxDB instance. This enables you to pull data from several sensors which may be in different locations into a single dashboard, as well as taking advantage of the fleet-management aspects of balenaCloud, which allows you to manage and update all devices simultaneously.
If you decide to have a go at expanding your balenaSense fleet and deploy some more devices, we would love to hear how it goes, similarly if you get stuck or have any questions, let us know in our forums at https://forums.balena.io, on Twitter @balena_io, on Instagram @balena_io or on Facebook. See you next time!