
With the release of multicontainer on resin.io, it’s easier than ever to integrate new components and functionality into your projects. In this tutorial, we’ll walk through extending our Getting Started with Multicontainer demo project to include fleet-wide metrics and monitoring capabilities using an external InfluxDB service. By the time we finish, we’ll be able to monitor and trigger alerts on various metrics across our fleet of devices.
Basic setup
For our example project, we’ve provisioned a small fleet of Raspberry Pi 3s into a newly created microservices application, which gives us access to all the new multicontainer goodness. In our newly created fleet, we’ve deployed the basic three-service getting started project. This project uses multiple containers to separate out the functionality of our application. There are two primary services: first, a frontend web server that serves up static web content on the device’s web-accessible device URL; second, a data service that reads CPU temperature data and blasts it onto a websocket. These two services are then nicely tied together using a proxy service, which routes requests to the correct service based on a specified path.
Our project’s docker-compose.yml shows how these three services are configured:
version: '2'
services:
 frontend:
   build: ./frontend
   expose:
     - "80"
 proxy:
   build: ./haproxy
   depends_on:
     - frontend
     - data
   ports:
     - "80:80"
 data:
   build: ./data
   expose:
     - "8080"
The first thing to notice is the ports specification on the proxy service. This field ensures that our proxy Docker container maps its port 80 onto port 80 of the host OS. This allows any requests coming in at port 80 on our device’s web URL to be routed to our proxy service, which can then decide the appropriate service for the traffic.
Each of our other services uses the expose field to make specific ports accessible to the Docker Compose default network. For example, if we make a request from the proxy container to data:8080, the Docker internal DNS will resolve that to the correct IP and port on the Docker network. Note that this port is not exposed on the host OS or externally, so if we try make a request on <DEVICE_IP>:8080, we will get no response.
Another important setting in our docker-compose.yml is the depends_on field, specified for the proxy service. This field allows us to loosely define the order in which our services will be started up. In our case, we want to only start our proxy after we have started up the two other services. It should be noted that the depends_on functionality doesn’t guarantee that the listed services are fully up and running before the dependent services are started. We still need to make our individual services resilient to cases where the services they depend on are not yet ready.
When we run this project on our fleet of Raspberry Pi 3s, accessing the device URL for any of our devices will show a CPU temperature graph similar to this:

Add some metrics tracking
Once we have our basic services up and running, we’ll want to add some simple metrics and monitoring for these containers. To do this, we’ll use the TICK stack developed by InfluxData. Specifically, we will be deploying the Telegraf (the T in TICK) collection agent on our fleet of devices. We’ll configure this to periodically offload its data to a server running the full TICK stack, where we can visualize the data and create alerts and integrations.
To add Telegraf to our project, we drop a new metrics service into our docker-compose.yml file:
 metrics:
   build: ./metrics
   pid: "host"
   network_mode: "host"
   privileged: true
   labels:
     io.resin.features.balena-socket: '1'
This service introduces three new Docker Compose features, namely pid, network_mode and privileged. The first two essentially map our container process IDs and network ports to that of the host OS namespace. This allows Telegraf to see all the processes and network activity running on the device, including host services. The privileged flag allows our metrics container to access /dev on the host OS and gather metrics from disk partitions and network devices.
The last interesting piece in our new service is the addition of the io.resin.feature.balena-socket label. This is one of many labels which are specific to resin.io and let us easily enable additional functionality for our services. In this case, our label tells the resin.io device supervisor to mount the balena container engine socket into our metrics container. This socket will be used by Telegraf to gather metrics about our set of containers, so we can see nice graphs of how individual services use memory, CPU, or other system resources.
One more thing we need for our metrics service to work properly is a telegraf.conf file. This configuration file allows us to define a set of plugins that monitor everything from basic memory consumption to DNS and ping response times. For a full list of plugins, check out the Telegraf documentation. Our config file also allows us to define where we offload the metrics. In our example config file, we define a environment variable, $INFLUX_URL, which we will further define as a Service Variable in the resin.io dashboard:
urls = ["$INFLUX_URL"]
With our new service defined, we can git add and commit the changes, then send to our application with git push resin master. We should see the service running along with the three other services we deployed previously:

Once the new service is deployed to our fleet, we’ll need to setup our backend server to collect all the metrics. The quickest and easiest way to do this is to sign up for a trial account at InfluxData. After that is set up, we can grab our InfluxDB URL and add it as a fleet-wide service variable for the metrics service. We will also need to add INFLUX_USER and INFLUX_PASS service variables to allow our devices to correctly authenticate with the Influx backend. Once these variables are applied, all the devices will restart the metrics service with the correct URL and start pushing new data to the cloud:

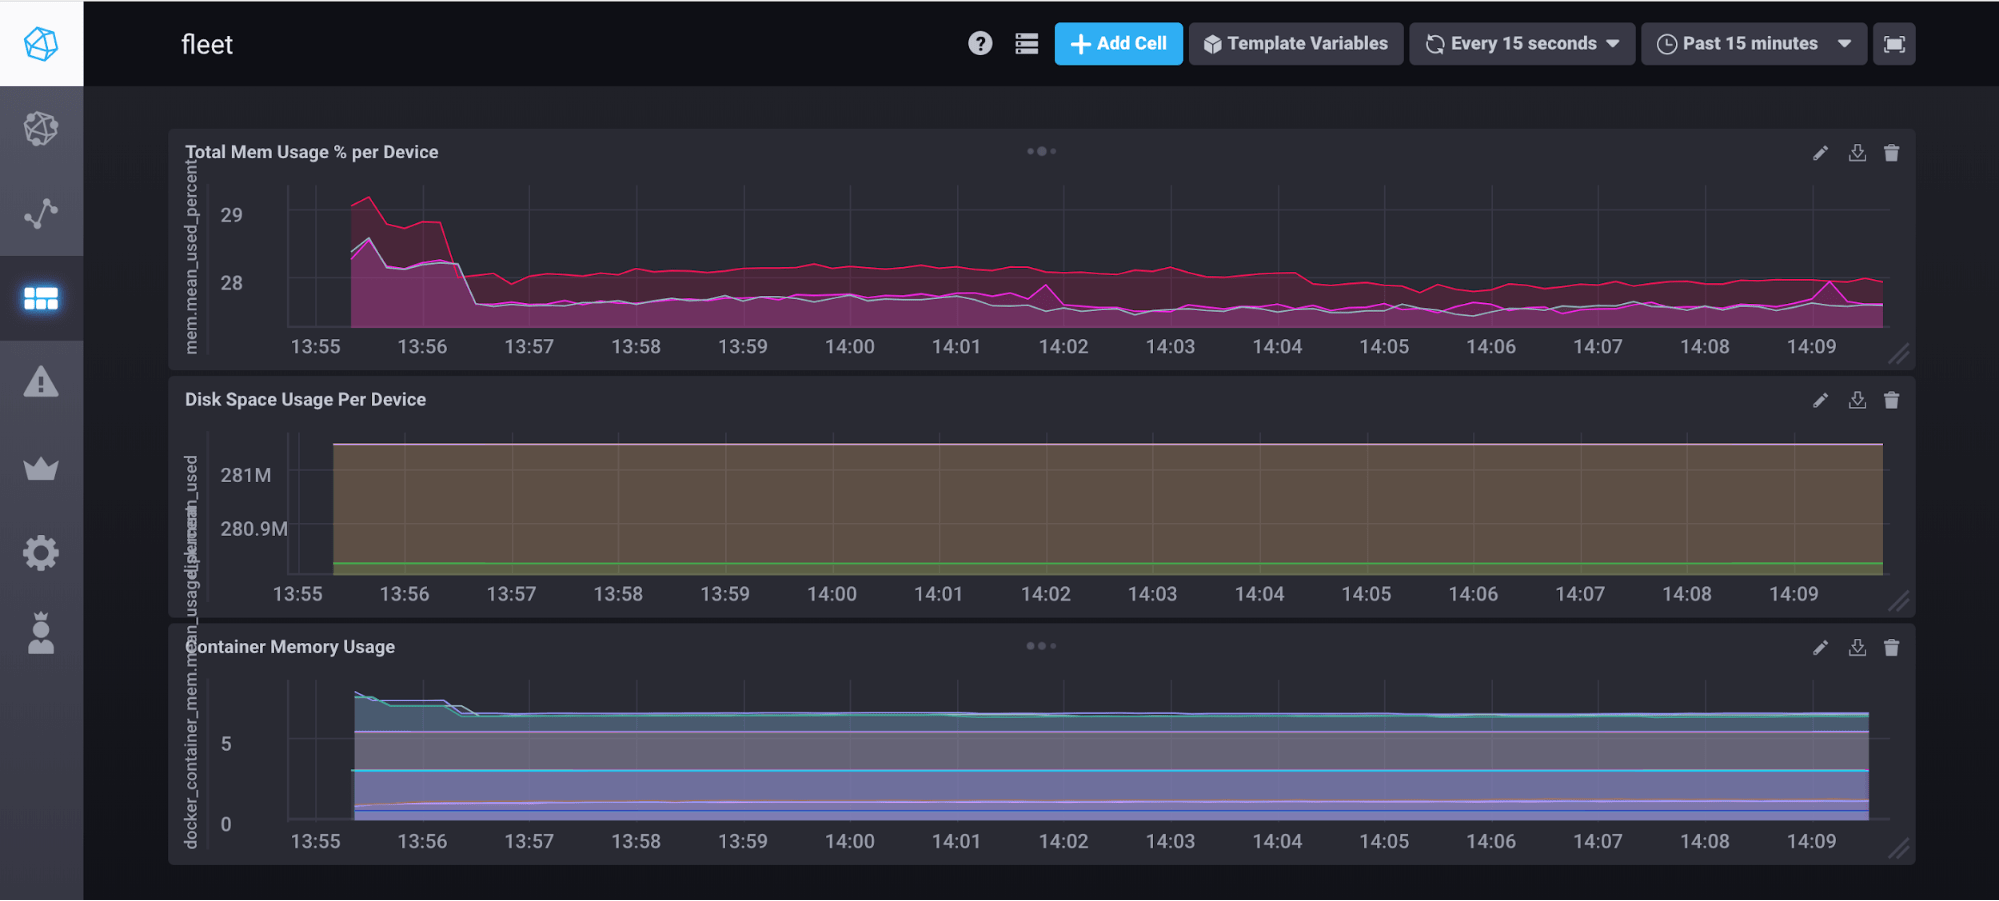
Now all of the devices in our fleet should be pumping out system metrics every 10 seconds or so to our InfluxDB backend. If we navigate to our Chronograf dashboard on the InfluxData site, we can construct fleet monitoring dashboards like the one below:

Once we get comfortable playing with the data and creating graphs, we can easily use the alerting functionality of Influx and Kapacitor to send us an email or PagerDuty alert if things start going haywire on our fleet.
For more information
If you want to check your project against one that has already been built, we’ve shared a repo for this extension to our basic multicontainer getting started. You can use what we’ve provided to double-check your docker-compose.yml and telegraf.conf files, or just clone the entire project and add your own changes.
To learn more about multicontainer on resin.io, be sure to check out our documentation. And as always, if you have any questions you can always reach us on our forums!